We are using celery with Django for some time now, and it uses RabbitMQ for the messaging backend. Sometimes post server updates, RabbitMQ goes down or due to heavy message load it slows down, in those cases currently we don't have any visibility. In order to monitor the queue, and get the the notification/alert in case of any alarming situation, we have setup monitoring on New Relic. Here are the steps -
There are various choice for RabbitMQ monitoring on New Relic, but we used this one.
On your server run following command -
1> pip install newrelic-plugin-agent
If it’s dedicated server and you have full access, get configuration file /opt/newrelic-plugin-agent/newrelic-plugin-agent.cfg to /etc/newrelic/newrelic-plugin-agent.cfg and edit the configuration in that file. In my case its shared webfaction server, so we installed on /home/username/newrelic/ folder. (we created newrelic folder on the home).
Update the license key, user under Daemon (who has access to run the process, also make sure you give proper access to that user to the newrelic folder)
3> Update the settings for rabbitmq
rabbitmq:
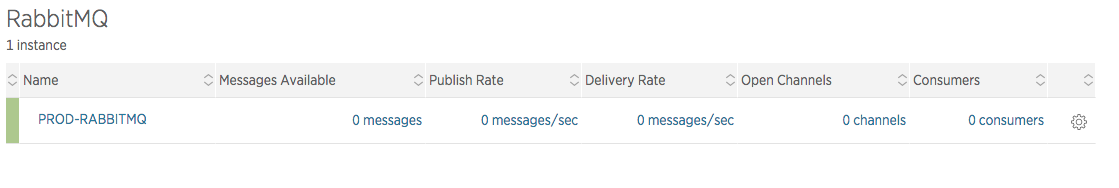
name: PROD-RABBITMQ
host: localhost
port: 15672
verify_ssl_cert: false
username:
password: vhosts:
queues: [
In above vhosts is optional, if you have simple setup and not that many hosts and queues, you can skip that and it will monitor all.
4> To run in debug mode for testing -
newrelic-plugin-agent -c newrelic-plugin-agent.cfg -f
Once you see that your setup is running fine, start it in background mode by removing -f
newrelic-plugin-agent -c newrelic-plugin-agent.cfg
Notes - It needs few things in order to this api calls to work for monitoring (Enable http UI for rabbitmq using rabbitmq_plugins)
> rabbitmq-plugins enable rabbitmq_management
Without enabling HTTP UI, it won’t be able to allow api access to monitoring service.
> once its enabled, you can try curl calls on /api on port 15672
Issues -
Getting nothing reported to newrelic
Reason -
curl -i -u username:password http://localhost:15672/api/vhosts
HTTP/1.1 401 Unauthorized
Server: MochiWeb/1.1 WebMachine/1.10.0 (never breaks eye contact)
Date: Fri, 16 Dec 2016 16:56:44 GMT
Content-Length: 57
{"error":"not_authorised","reason":"Not management user"}
Solution -
I had to create another user specifically for the monitoring, with administrator tag and proper permissioning as per the RabbitMQ documentation